
A childhood toy sparked a digital obsession
TL;DR – Why This App is Worth Your Time
I took the childhood wonder of spirograph drawing and rebuilt it as a browser-based spirograph generator app that animates mathematically perfect curves with color gradients, variable line widths, and even 3D-style distortion. This isn’t just nostalgia. It’s a full-on math-art experience. Whether you’re an educator, artist, coder, or just curious, this tool turns parametric equations into mesmerizing visuals that feel both playful and profound.
I vividly remember being ten years old, hunched over a plastic spirograph set, watching in pure amazement as simple gears created these impossibly intricate patterns. The rhythmic clicking of the pen against the gear teeth, the anticipation as each loop revealed more of the design, it felt like magic. That childhood wonder never really left me.
Fast-forward twenty years, and I found myself staring at parametric equations in a late-night coding session, when it hit me: these formulas were creating the same mesmerizing patterns I’d loved as a kid. That spark of recognition led me down a rabbit hole that culminated in something I’m genuinely excited to share, an Interactive Spirograph Generator that brings mathematical art to life in ways those plastic gears never could.
Beyond the Toy Store Version
What started as nostalgic tinkering evolved into something much more sophisticated. While traditional spirographs are limited by physical constraints, this digital version lets you explore mathematical relationships that would be impossible to achieve with gears and plastic rings.
The mathematical foundation is elegantly simple. Think of hypotrochoids and epitrochoids as the graceful paths traced by points on circles rolling around each other—like an intricate clockwork dance. The equations themselves are surprisingly straightforward:
Hypotrochoid equations (circles rolling inside):
- x = (R-r)cos(t) + d×cos((R-r)/r × t)
- y = (R-r)sin(t) – d×sin((R-r)/r × t)
Epitrochoid equations (circles rolling outside):
- x = (R+r)cos(t) – d×cos((R+r)/r × t)
- y = (R+r)sin(t) – d×sin((R+r)/r × t)
Where R, r, and d control the size relationships, and t traces the curve through time. Simple inputs, infinitely complex outputs.
Watching Math Come Alive
The real magic happens when you hit “Start Animation.” Instead of static images, you watch each pattern draw itself in real-time, with a small indicator showing exactly where the virtual pen travels. There’s something hypnotic about seeing mathematical precision unfold at your chosen pace, from a meditative crawl at 0.1x speed to a rapid 4x blur that reveals the full pattern in seconds.
The color system alone took weeks to perfect. Sure, you can stick with solid colors for that classic look, but the gradient transitions are where things get interesting. Colors flow smoothly between hues with customizable repeat cycles, and here’s where I got a bit carried away, I added z(t) color integration, where a third mathematical dimension controls the color variations. Suddenly, your spirographs aren’t just moving through space; they’re breathing with color.
Variable line width was another happy accident. While testing different rendering approaches, I discovered that changing the line thickness throughout the pattern added this incredible sense of depth and movement. What started as a bug became one of my favorite features.
The z(t) Breakthrough
This is where I probably got too excited for my own good, but the results speak for themselves. Traditional spirographs exist in two dimensions, but what if we added a third? The z(t) parameter creates complex distortions that transform simple curves into something that feels almost three-dimensional on your screen.
Here’s how the magic works: the z(t) function generates values that modify the original x and y coordinates. Instead of just plotting the classic spirograph equations, the final coordinates become:
- Final x = original x + z(t)
- Final y = original y – z(t)
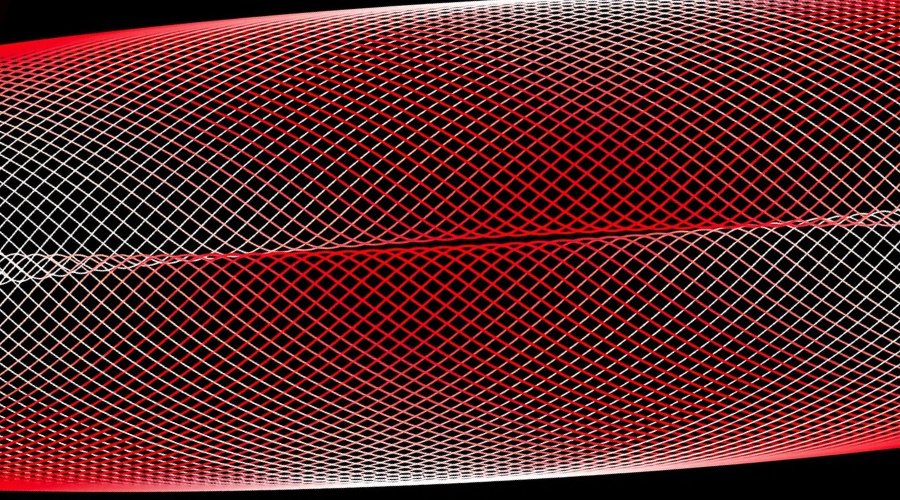
This creates a push-pull effect where the z values simultaneously stretch the pattern horizontally while compressing it vertically, or vice versa. When z(t) oscillates between positive and negative values, the entire pattern appears to breathe and undulate.
In Symmetrical Mode, the app uses balanced distortions with z = A(sin(ft) + cos(ft)), where both sine and cosine contribute equally, creating patterns that pulse with perfect symmetry. Custom Mode gives you complete control with z = A×sin(n×t) + B×cos(m×t), letting you craft asymmetrical distortions. When the frequencies n and m are different, you get these fascinating interference patterns where the distortion itself becomes a complex wave riding on top of your spirograph.
The result? Distortions that range from subtle warping, like viewing the pattern through gentle water ripples, to dramatic transformations that barely resemble their original spirograph ancestors.
A Gallery of Mathematical Personalities
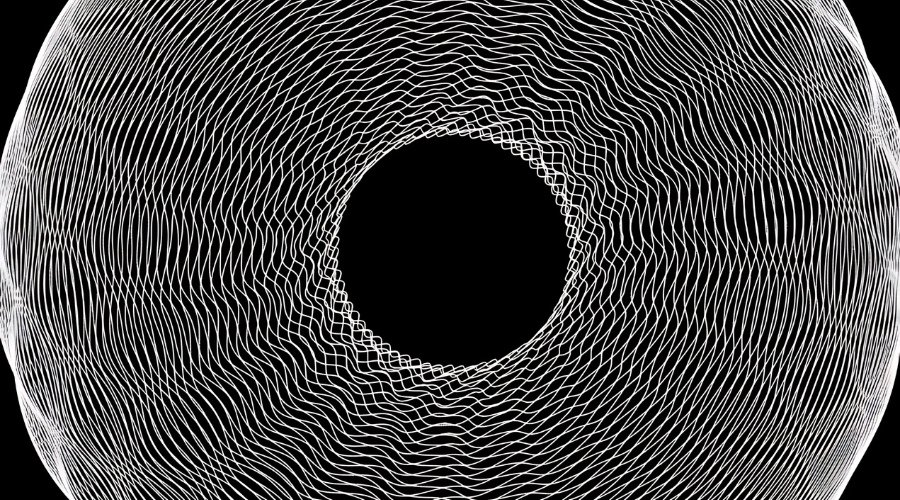
Rather than overwhelming users with infinite possibilities, I crafted twelve presets that each showcase different mathematical relationships. The “Infinite Slinky” preset uses epitrochoid equations with z(t) modulation to create this mesmerizing slinky-like motion that seems to roll endlessly across the screen. “Glacial Eye” produces cool, crystalline patterns with a glowing center that genuinely resembles looking into a frozen mandala.
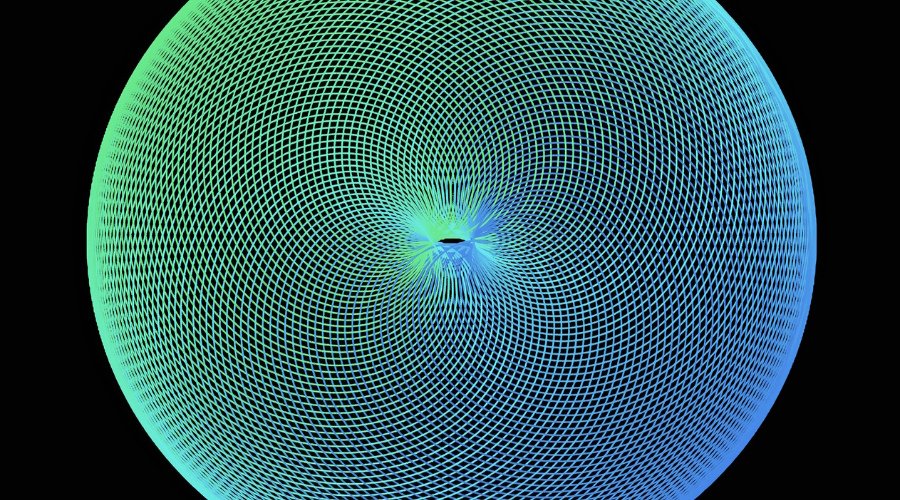
My personal favorite is “Electron Donut” as it creates these donut-shaped patterns that look remarkably like electron orbital visualizations. There’s something deeply satisfying about stumbling across patterns that mirror natural phenomena through pure mathematical chance.
From Curiosity to Creation
Getting started is deliberately simple. New users can dive straight into the presets. I recommend beginning with “Glacial Eye” because the color transitions are genuinely mesmerizing. Click “Start Animation” and watch the mathematics unfold.
Once you’re hooked (and you will be), the real exploration begins. The basic parameters are intuitive and powerful:
- Outer Radius (R): Controls overall pattern size and scope
- Inner Radius (r): Determines complexity through its ratio with the outer radius
- Pen Distance (d): Changes how the drawing point relates to the inner circle’s center
Small adjustments to any of these create dramatically different results. For the mathematically adventurous, toggling between hypotrochoid and epitrochoid modes reveals completely different pattern families. The z(t) parameters open up three-dimensional possibilities that would be impossible with physical gears.
The Unexpected Joy of Mathematical Art
What began as nostalgic programming has become something much more meaningful. Every preset represents hours of experimentation, tweaking parameters until mathematics produced something unexpectedly beautiful. The app has shown me that the boundary between logical precision and creative expression is much blurrier than I’d imagined.
There’s genuine magic in watching a complex pattern emerge from simple mathematical relationships. The “Neon Tangle” preset creates these vibrant, seemingly chaotic tangles that somehow resolve into perfect symmetry. “Noir Petal” produces elegant dark petals with sophisticated curves that feel almost organic despite their mathematical origins.
Why This Matters Beyond Pretty Pictures
In our increasingly digital world, tools that make mathematics visual and interactive serve a crucial purpose. They bridge the gap between abstract concepts and tangible understanding, showing that mathematical precision can be a pathway to beauty rather than just a means to solve problems.
The app has found its way into classrooms, art studios, and the screens of curious minds who simply enjoy watching mathematical principles create something timelessly elegant. It’s proof that the tools we build for our own curiosity often serve purposes we never anticipated.
Your Turn to Explore
Ready to rediscover the magic of mathematical patterns? Load up the app, select the “Electron Donut” preset, and prepare to lose yourself in the hypnotic dance of circles and curves. Start with the presets to understand the possibilities, then venture into custom parameters to create something uniquely yours.
The mathematics may be centuries old, but the wonder of watching equations bloom into art feels as fresh as that first childhood encounter with a spirograph. Sometimes the best way to understand something complex is to play with it until it becomes beautiful.
Have you ever surprised yourself by creating something beautiful through code? I’d love to hear about the moment you realized technology could be a canvas for art.
Sources:
- Author Unknown. (n.d.). Spirograph. En. Retrieved July 31, 2025, from https://en.wikipedia.org/wiki/Spirograph